

Fat-Free Mass Index
See beyond body weight. Understand your fat-free mass.
Your FFMI
Kouri 1995 normalization: coefficient 6.3
What your weight is made of

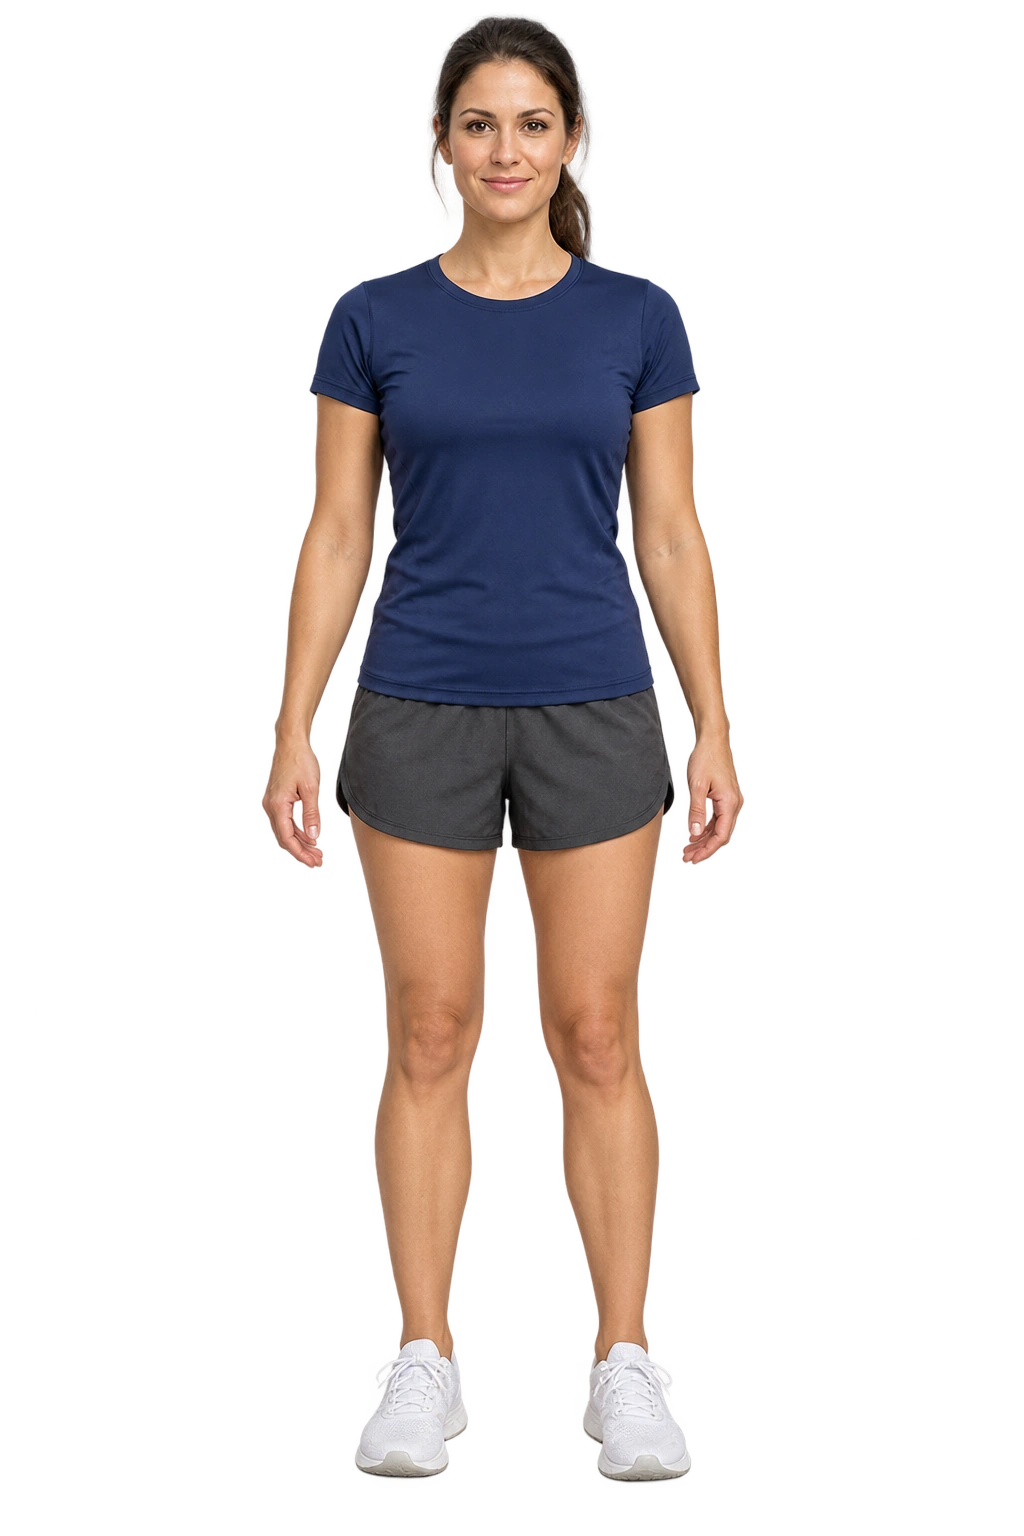
Fat-free mass includes muscle, bone, organs and body water.


Put the number in context
25 is a study reference, not a verdict.
The original research studied male athletes. A single FFMI result cannot identify steroid use or define an individual’s genetic potential.
The coloured bands are illustrative intervals, not health or drug-use categories. Values outside 15–28 remain visible numerically; the marker stays at the nearest edge.
The method, clearly explained
Fat-free mass = 80 × (1 − 0.15) = 68.0 kg
Raw FFMI = 68 ÷ 1.78² = 21.46
Normalized = 21.46 + 6.3 × (1.80 − 1.78) = 21.59
Calculations use unrounded values. Displayed results are rounded. Formula inputs are converted to kg and metres before calculation.
Measurement and interpretation limits
Body-fat estimation error, hydration and measurement method affect fat-free mass. The figure is illustrative and does not change shape to represent a measured physique.
Software input checks: adults only, height 100–250 cm, weight 25–350 kg and body fat 1–75%. These bounds are not healthy reference ranges. Male reference bands are illustrative intervals: below 18, 18–20, 20–22, 22–25, and 25 or more. They do not establish health, training status or substance use. No male-derived band is assigned to women.
The original paper used 6.3 for the height correction; the optional 6.1 variant is labelled separately. The correction is not validated as a universal formula across sexes and populations.
Frequently asked questions
Is fat-free mass the same as muscle?
No. Fat-free mass includes skeletal muscle, organs, body water, bone and other non-fat tissue. FFMI is not a direct measure of skeletal muscle mass.
Does a score above 25 prove steroid use?
No. The 1995 study reported preliminary findings in a specific sample of male athletes. Measurement uncertainty and population differences matter. FFMI alone cannot identify drug use or define a personal genetic ceiling.
Why do some tools use 6.1?
Many calculators use a 6.1 height-correction coefficient. The original Kouri 1995 abstract specifies 6.3. This studio offers both with clear labels and uses 6.3 by default. At 1.80 m the adjustment is zero for both.
How much does body-fat accuracy matter?
It directly affects fat-free mass. At 80 kg and 1.78 m, a one-percentage-point body-fat difference changes raw FFMI by about 0.25. Compare measurements taken with a consistent method.
Does changing Male / Female change the calculation?
The fat-free mass and raw FFMI formulas are the same. The selection changes the illustration and reference context. The height correction was derived from male athletes, so normalized results for women are an extrapolation rather than a validated reference.
Sources & references
References inform the calculation; no institutional endorsement.
Explore related calculators
Body Adiposity Index
See beyond body weight. Understand your fat-free mass.