

Cycling Power Output Calculator
Power & Aerodynamics Studio
Explore how speed, posture, wind and hills change your watts.
Power dashboard
Where your power goes
Steady speed · no acceleration or braking.
W/kg uses rider mass, not rider + bike. This is not an FTP test or rider classification.
See the forces behind your ride
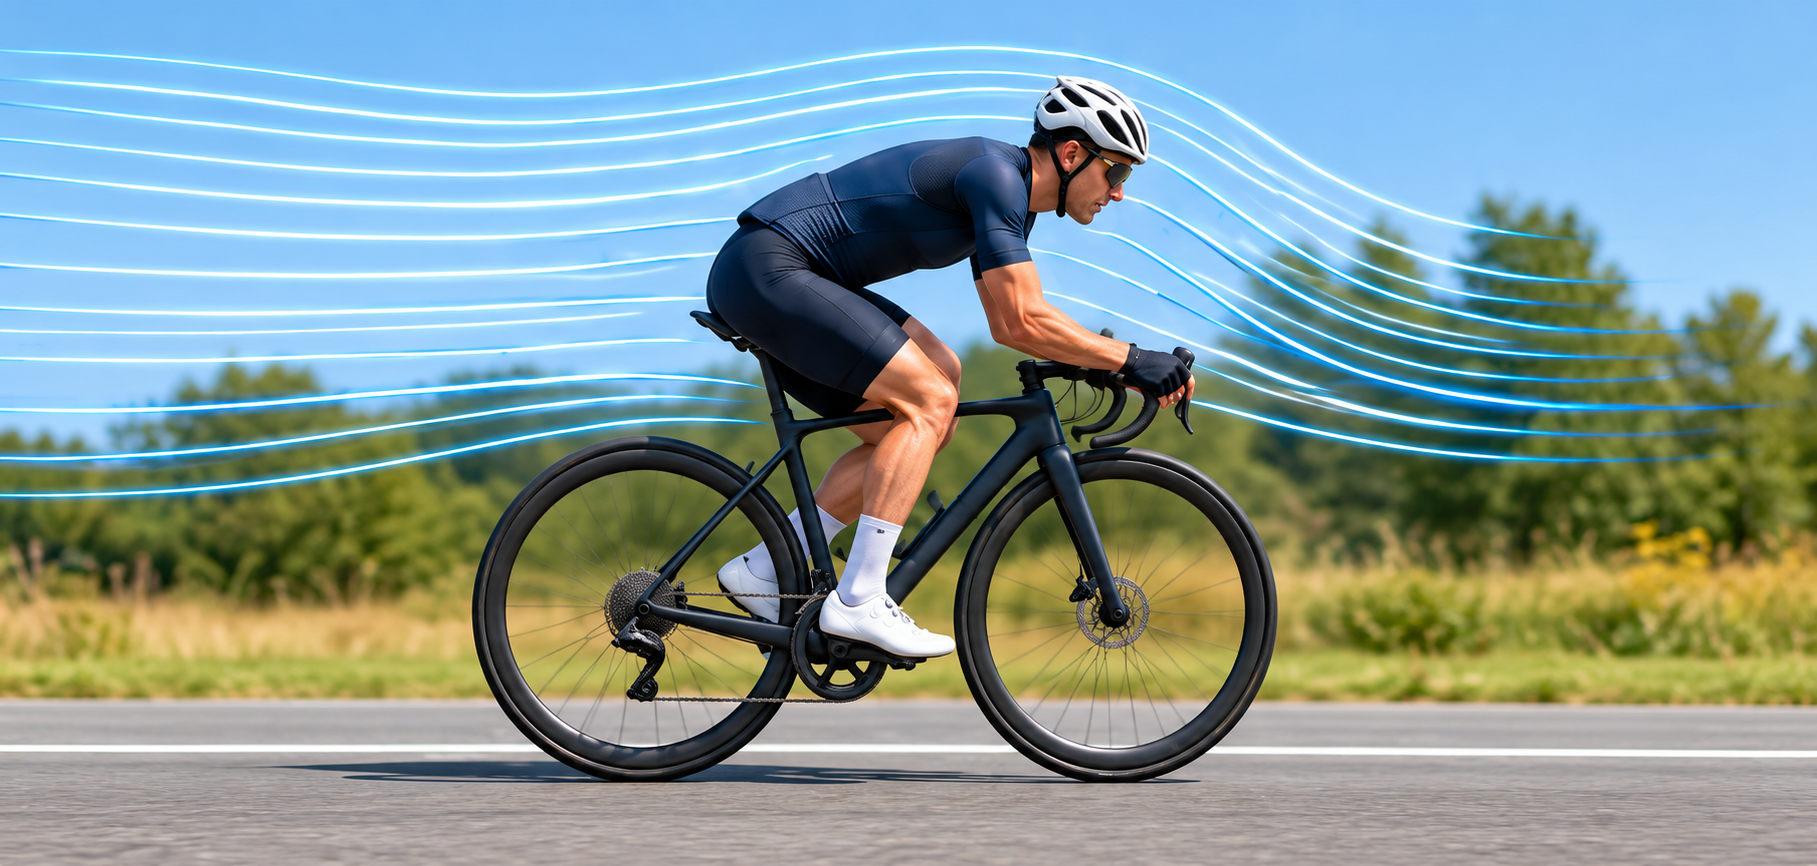


Position comparison at 30 km/h
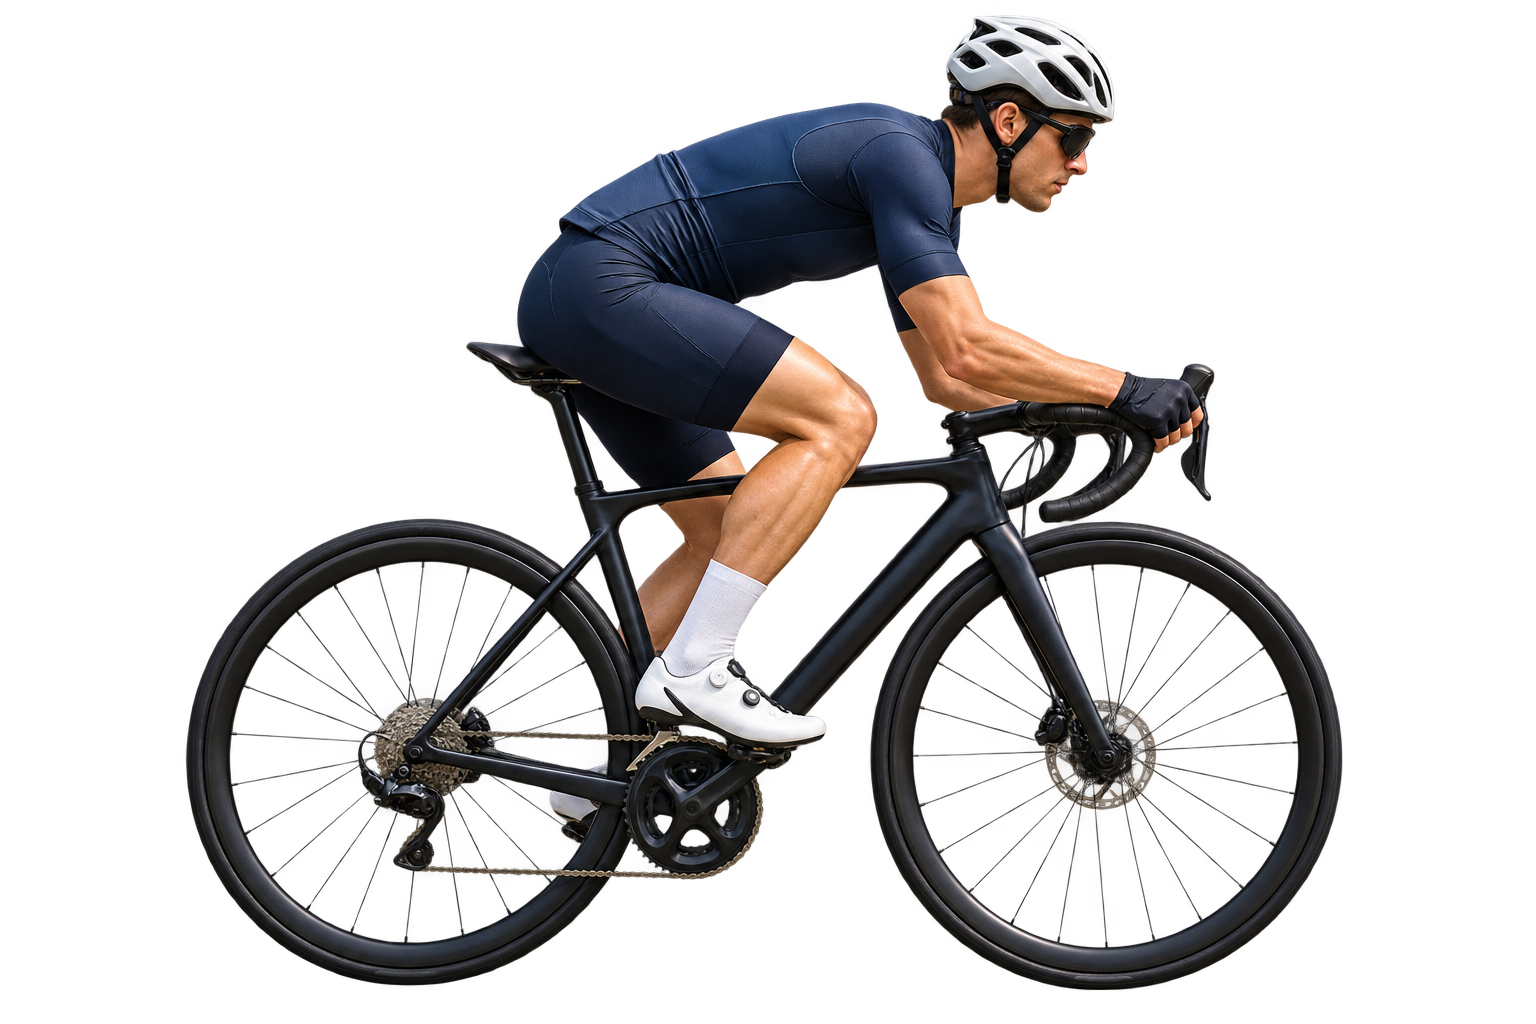
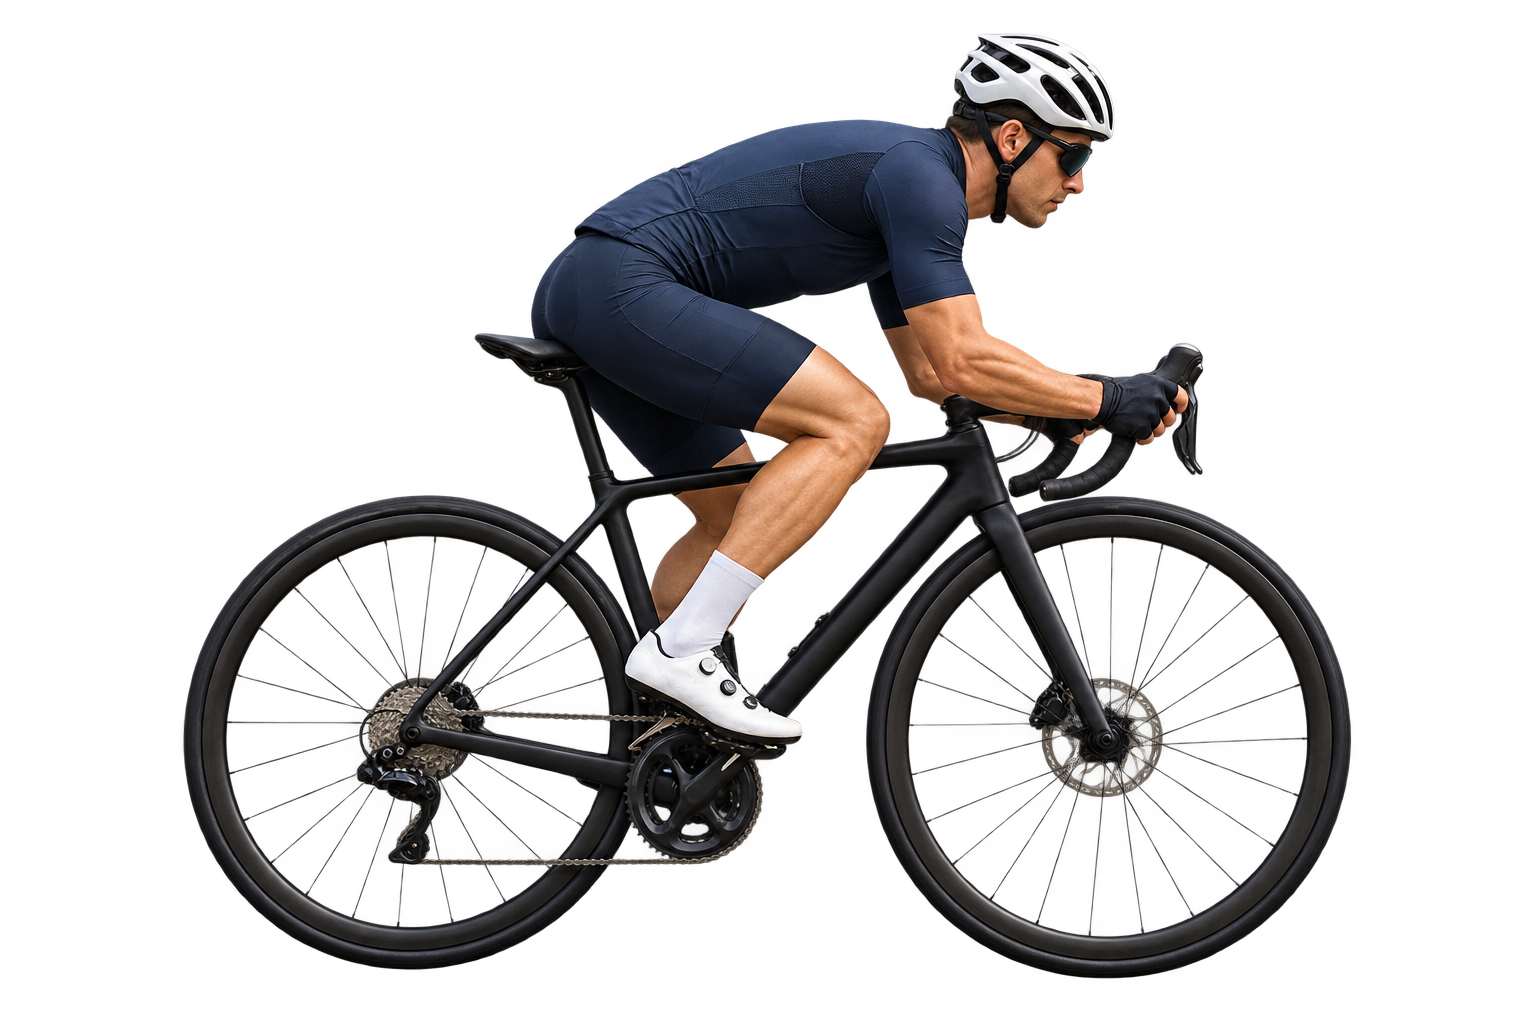
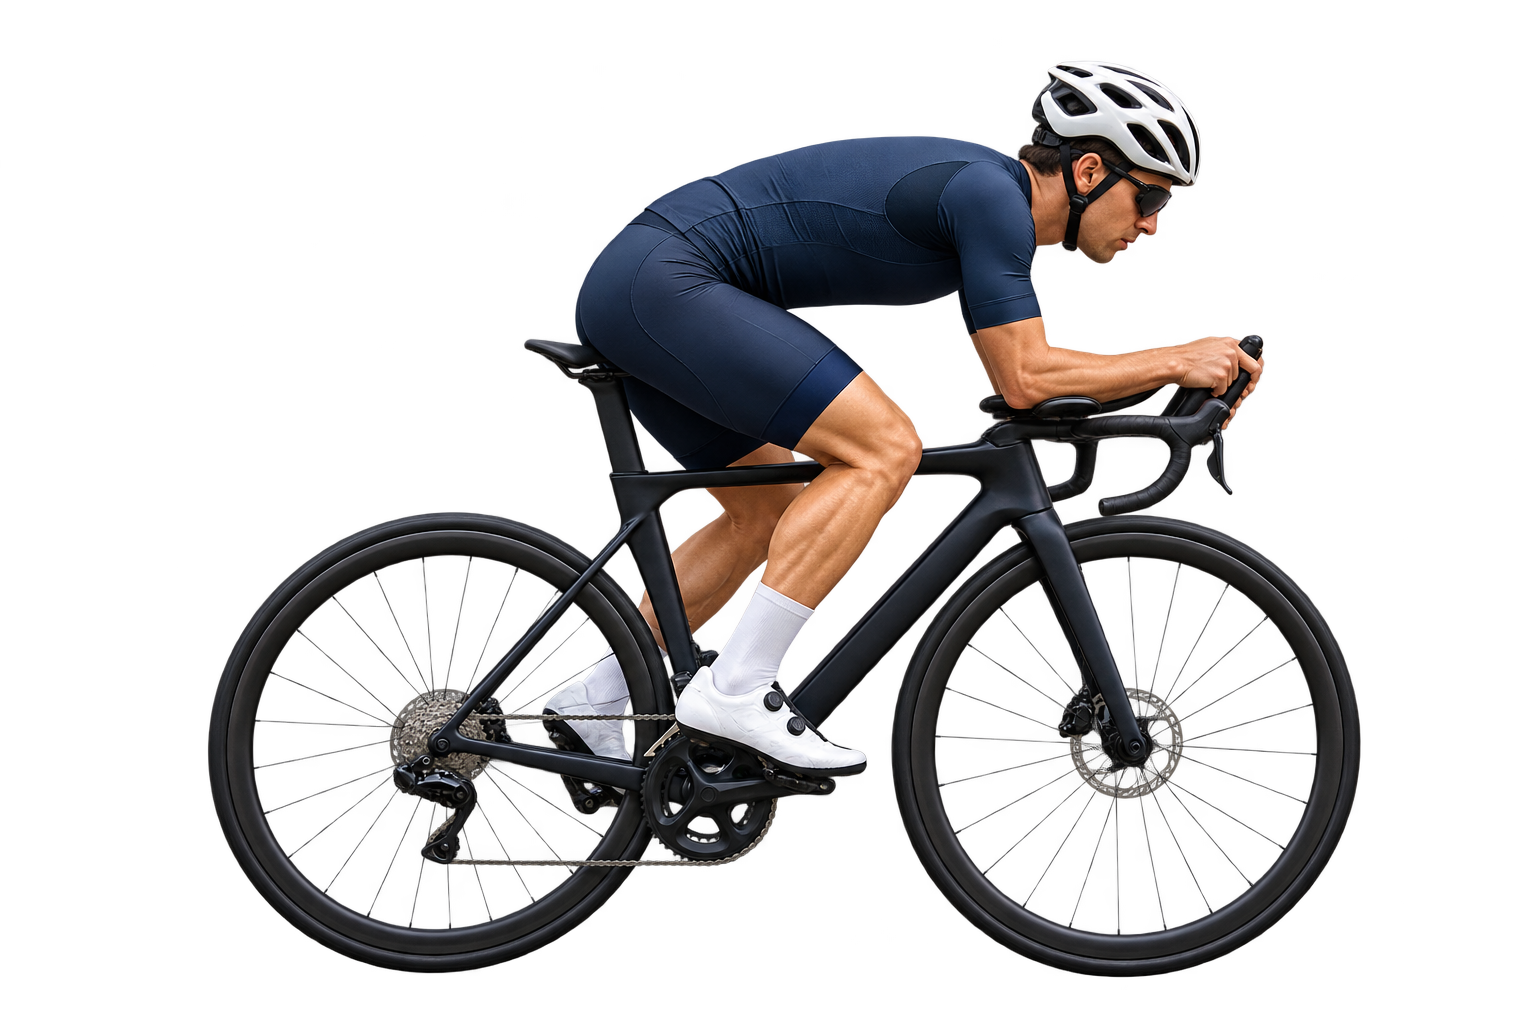
Same ride inputs, different example drag areas.
Illustrative airflow · not a wind-tunnel simulation. Signed forces may assist or resist motion.
Speed increases dragIn still air, aerodynamic power grows with the cube of speed.
Hills add climbing workMass and road gradient determine gravity's contribution.
Posture changes CdAA lower drag area reduces aerodynamic resistance.
Formula & worked example
Pcrank = max(0, Pair + Proll + Pgravity) / η
30 km/h, 75 kg rider + 10 kg bike, no wind, level road:
113.4 + 34.7 + 0 = 148.1 W at the wheel.
148.1 / 0.97 ≈ 153 W · 152.7 / 75 ≈ 2.04 W/kg
Full equations & downhill behavior
θ = atan(gradient / 100); u = v + headwind; m = rider + bike mass.
Pair = ½ρ CdA u |u| v
Proll = Crr m g cos(θ) v
Pgravity = m g sin(θ) v
All velocities in m/s; masses in kg; g = 9.80665 m/s². Crank power = max(0, total wheel power) / η. η = efficiency / 100.
A tailwind faster than the bicycle gives negative aerodynamic power. Negative net wheel power means coasting is sufficient and braking would be needed to hold that speed. The tool reports zero pedaling power and the estimated excess wheel power separately. Negative components are shown below zero, not as positive pie-chart shares.
This transparent simplified resistance model is not the complete validated Martin model or a power-meter measurement.
Frequently asked questions
How accurate is this estimate?
Accuracy depends on actual drag area, tyres, surface, wind and mass. A power meter measures your ride; this steady-speed model helps compare assumptions.
Can tailwinds reduce power?
Yes. Wind is positive for headwind and negative for tailwind. A tailwind faster than your road speed assists motion. Crosswinds are not modeled.
Which weight is used for W/kg?
Crank watts are divided by rider mass. Rider plus bike and carried load are used for gravity and rolling resistance.
Why does posture matter?
Posture changes effective drag area (CdA). Presets are illustrative and vary by rider, clothing, bicycle and fit.
Does a downhill result mean negative pedaling?
No. Pedaling is clamped to zero. If net resistance is negative, the displayed braking requirement is the excess wheel power at the chosen steady speed.
Sources & references
(1998)Road cycling power modelJ Appl Biomech 14:276–291.
DOI: 10.1123/jab.14.3.276Model
assumptionsEditable physics parametersCdA, rolling resistance, air density and efficiency.
Independent educational tool. No affiliation or endorsement. Reference checked 19 October 2026.
Related cycling calculators
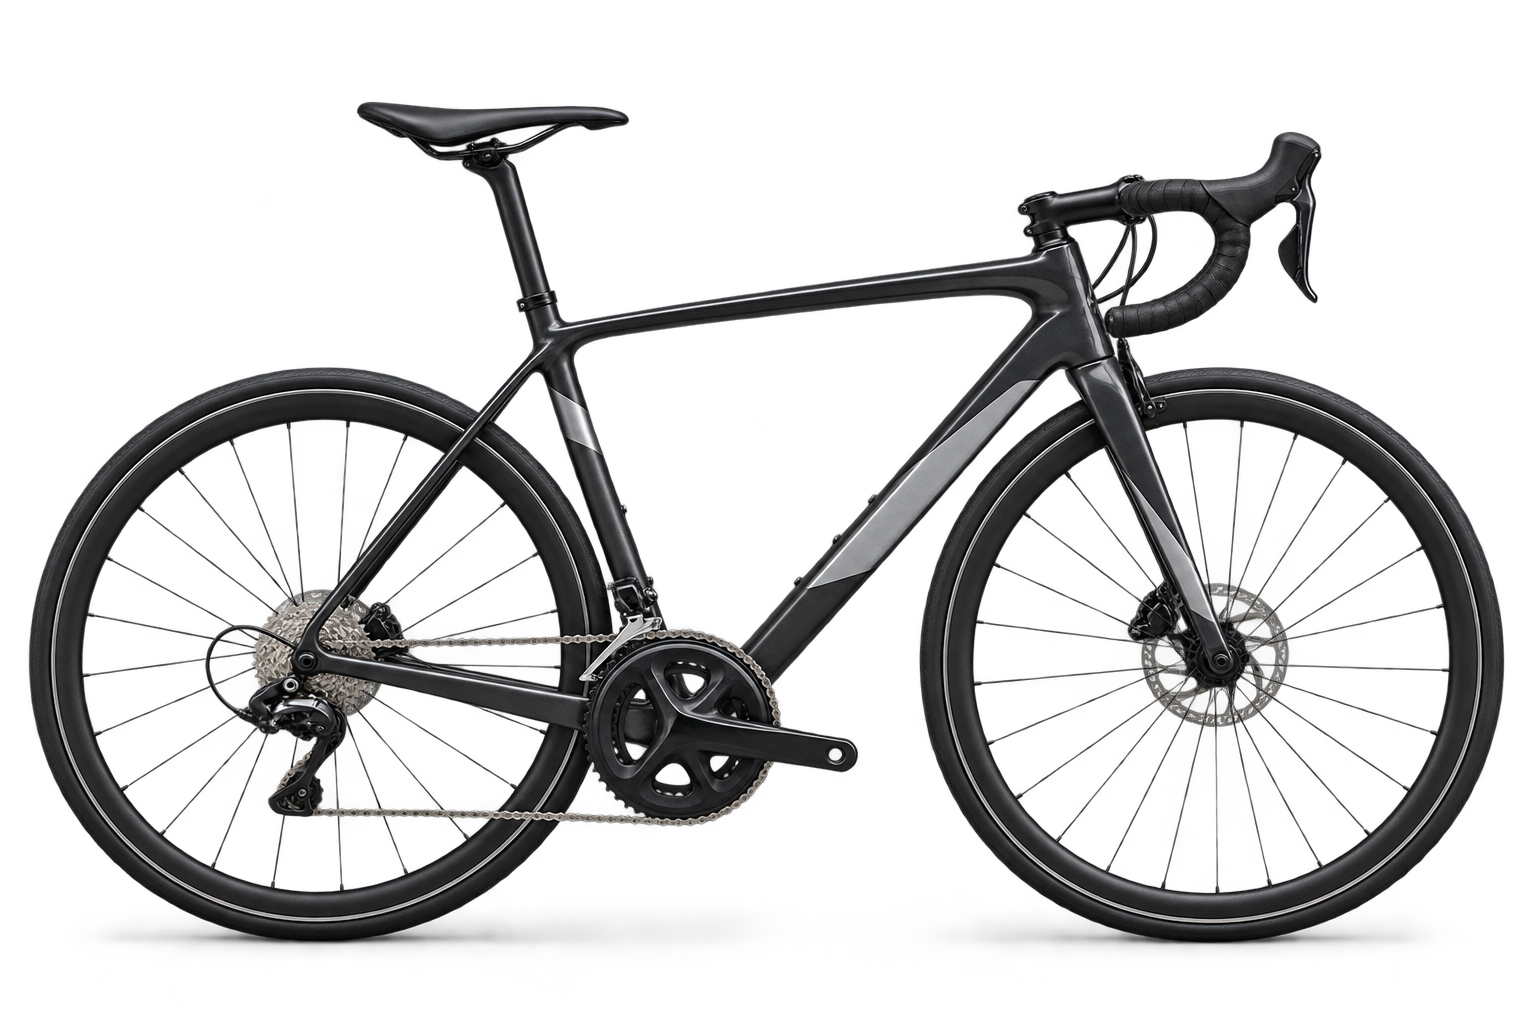
Explore how speed, posture, wind and hills change your watts.