

Protein Concentration Calculator
From absorbance to concentration. From stock to working solution.
Bradford · BCA / Lowry · UV A280 · Mass & volume.
Assay & Sample
Result
Original sample concentration
2.500 mg/mL2,500 µg/mL · Bradford assay
This confirms interpolation range, not assay validation.
Equivalent concentrations
Standard curves depend on reagents, protocol and protein composition.
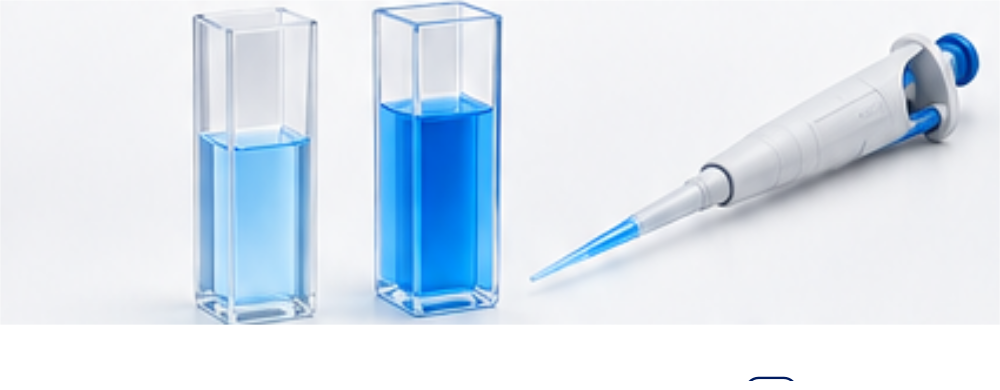
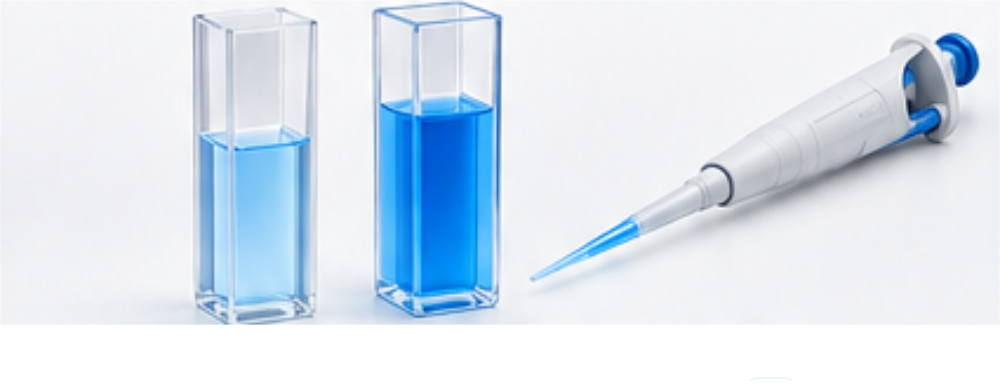
Standard Curve & Sample Interpolation
Fit equation
A = 0.800C + 0.050- Slope
- 0.800
- Intercept
- 0.050
- R²
- 1.0000
A high R² alone does not establish assay accuracy; no extrapolation.
Working Dilution & Aliquot Prep
Dilution only: target above stock requires concentration, not negative buffer volume. Protein amount is conserved in this ideal mixing calculation.
Pipetting Guide
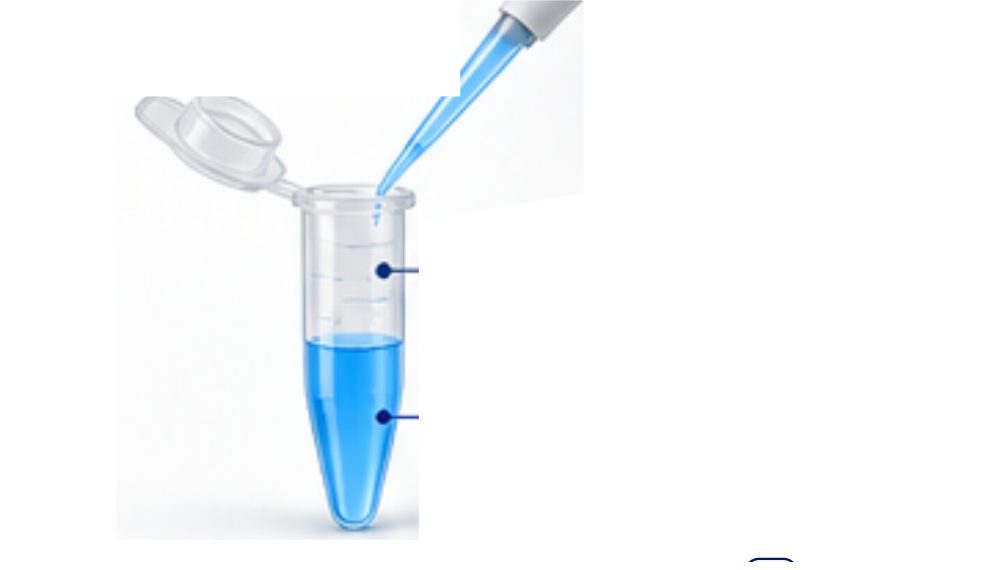
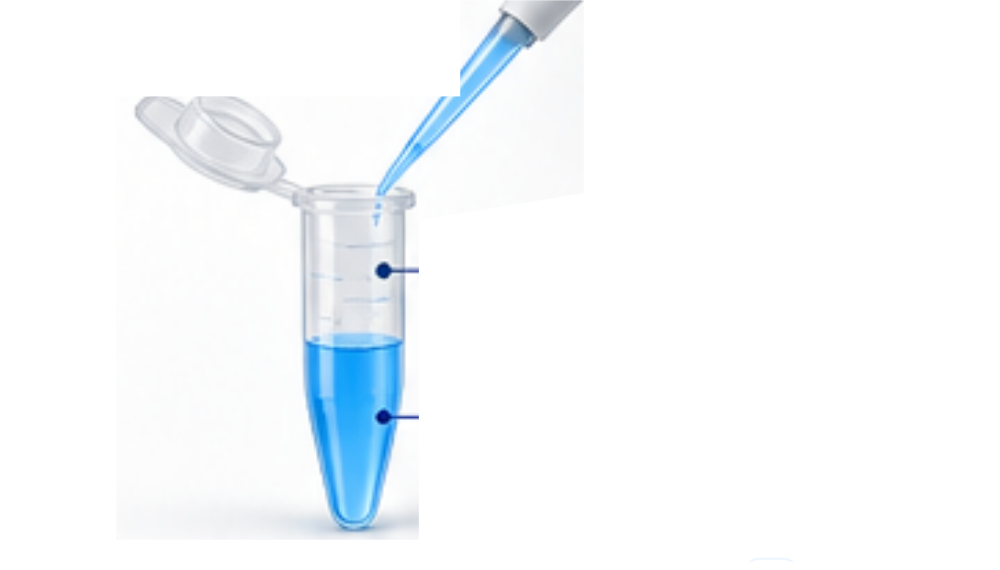
Volumes are calculated values; drawing not to scale. Use calibrated pipettes and follow your laboratory protocol.
Understanding your result
A = mC + b
C = (A − intercept) / slope
Coriginal = Cmeasured × DF
UV A280 and mass/volume methods
A = εlc. Use a protein-specific molar extinction coefficient, molecular weight and path length in cm. Molar concentration multiplied by molecular weight in g/mol gives g/L, numerically equal to mg/mL. Direct mode: C = mass / volume. Concentration alone does not demonstrate purity.
BCA (562 nm) and Lowry (~750 nm)
Use standards and settings appropriate to your specific kit/protocol. These assays are not interchangeable by wavelength alone. The tool uses your empirical standards, not universal assay coefficients.
Blank correction, fit choice and dilution factor
Enter standards and unknown using the same blank treatment. No automatic blank subtraction is applied. In raw mode a zero standard, fitted intercept or first interpolation segment represents blank response. Do not subtract again from already corrected readings.
Linear regression is unweighted OLS with an estimated intercept; verify suitability for your assay range. Point-to-point connects monotonic adjacent standards. R² is shown for the linear fit only and is not validation. Average replicates before entry; uncertainty and detection limits are not inferred.
DF is prior sample dilution. Reagent dilution shared with standards is not added again unless the protocol specifically requires it.
Frequently asked questions
Why can Bradford curves be nonlinear?
Dye-binding response depends on protein composition, reagents and concentration range. Use a suitable empirical calibration rather than assuming universal linearity.
What if the unknown lies outside the standards?
The tool declines to extrapolate. Re-dilute or concentrate appropriately and re-measure against bracketing standards.
Does R² verify assay quality?
No. A high R² does not rule out blank, matrix, pipetting or calibration errors. Inspect residuals and follow validated laboratory procedures.
Does DF include assay reagent volume?
This field is for pre-assay dilution. Shared reagent dilution is represented in the standard curve. Follow the protocol and avoid double correction.
Can I compare different proteins directly?
Response can differ by protein composition. BSA calibration may give BSA-equivalent concentration for another protein; appropriate controls and method suitability are needed.
Sources & References
 Thermo Fisher ScientificProtein assay data analysis & calibration guidance.
 Merck / Sigma-AldrichProtein quantitation and assay principles.
Educational laboratory calculations; not a validated analytical method or institutional endorsement.
From absorbance to concentration. From stock to working solution.
Bioprocess capacity planning
Working with product-specific analytical inputs? Our Vaccine Production Calculator separates formulation volume, container counts and fill-line capacity from optional mass-balance estimates. It is an arithmetic planning tool, not a manufacturing protocol.