

Vegetable Yield Calculator
Plan your beds. Estimate your harvest.
Select a crop to load its editable example rates.
Garden & Yield Inputs
Harvest Forecast & Breakdown
Planning scenarioStep-by-step solution
Your harvest scenario
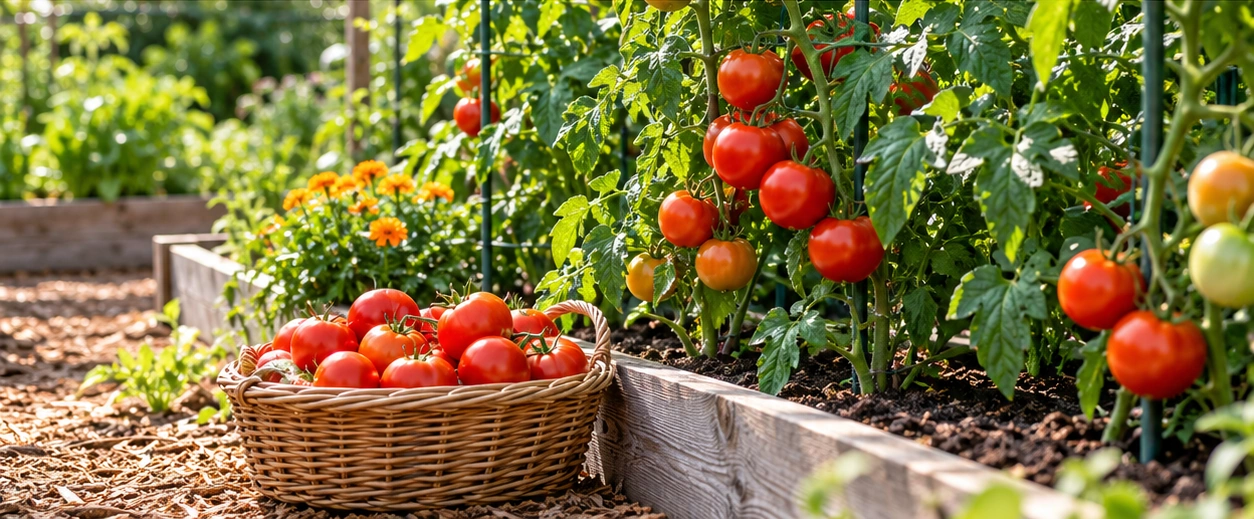

Illustrative tomato harvest • crate count is calculated separately.
Text summary · PDF in member tools
How the harvest estimate is built
- Harvest = area or plants × base rate × scenario factors
- Weekly average = seasonal harvest ÷ harvest weeks
- Crates = ceil(harvest ÷ crate capacity)
Area and per-plant rates are separate inputs. Scenario range = harvest × (1 ± spread). One season/harvest period is modeled; successive sowings are not automatically added.
Frequently asked questions
Are these yields guaranteed?
No. This arithmetic planner multiplies your area or plant count by an editable seasonal rate and scenario factors. Actual production depends on crop variety, planting density, weather, pests and management. The default rate is an illustrative input, not a verified yield for your plot.
Do growing systems always change yield by a fixed percent?
No. Raised-bed 100%, rows 60% and greenhouse 140% are editable comparison scenarios, not universal agronomic factors. All area inputs exclude paths; the row factor is not an additional automatic deduction for paths. Use local records and set 100% if your base yield already accounts for the system. Similarly, avoid adding a conditions factor when it is already included in the base rate.
How does plant-count mode work?
Enter established plant count and seasonal harvest mass per plant. Area yield and plant yield are independent assumptions; the calculator does not invent planting density or derive one from the other. Switching units preserves each stored physical yield rate.
Does the weekly average predict harvest timing?
No. It divides total seasonal yield by the entered number of harvest weeks. Determinate and indeterminate crops and successive sowings can produce very different time distributions. The weeks input is the harvest window, not days from planting to maturity.
Show all questionsShow fewer questions
What does the Vegetable Yield Calculator calculate?
It calculates expected seasonal harvest mass, an assumed scenario range, average weekly harvest, adjusted yield per area or plant, and equivalent crate capacity. The decorative tomato photograph does not show literal crop quantity and remains illustrative for all crop choices.
Which values should I enter?
Use planted area excluding paths, or established plant count; then enter a seasonal base rate appropriate for your variety. Crop cards set editable grouped examples: tomato 0.5 lb/ft\u00b2 and 5 lb/plant; roots 0.6 and 0.125; leafy greens 0.18 and 0.125; vines 0.4 and 3. Other varieties may differ substantially. Conditions examples are poor 70%, average 100%, optimal 115%; edit them as needed.
What formula does this calculator use?
Expected yield = quantity \u00d7 base rate \u00d7 system factor \u00d7 conditions factor, using fractions for percentages. Weekly average = expected yield \u00f7 harvest weeks. The scenario range applies the chosen \u00b1 percentage. Crates round up from total mass divided by usable crate capacity.
Why might my result differ from another source?
Sources may use different crops, field area versus planted area, growing seasons, planting density, varieties or harvest units such as fruit counts and bunches instead of mass. The \u00b1 spread is an assumption, not a statistical confidence interval or a source-provided crop variability estimate.
Does the result update automatically?
Yes. Inputs, crop/system scenarios, conditions and unit choices update results immediately. A manual base-rate edit clears the preset selection to indicate a custom yield input. Invalid active inputs clear the numeric forecast rather than leaving a stale result.
Are the crates a shipping or storage recommendation?
No. They are equivalent capacity containers calculated from the entered mass capacity. Full crates use floor(harvest \u00f7 capacity); one partial crate is added for a remainder. Crop shape, packaging, spoilage, handling and load restrictions need separate planning.
Are these yields for raised beds, and how can I improve yield?
The default raised-bed factor is 100% for comparison; it is not a universal raised-bed yield table. Follow crop-specific guidance, select locally suitable varieties, manage spacing, soil, irrigation and pests, and use measured past yields to calibrate the rate. The linked OSU and Cornell guides provide growing context, not endorsement of these example rates.
About this calculator
Vegetable yield varies by crop, variety, spacing, climate, soil, management and harvest stage. Enter a rate from a relevant gardening or agricultural reference.
What does the Vegetable Yield calculate?
Vegetable yield varies by crop, variety, spacing, climate, soil, management and harvest stage. Enter a rate from a relevant gardening or agricultural reference.
Sources & References


Related calculators

Vegetable Yield Calculator Estimate vegetable garden yield based on bed area and vegetable type using standard yield-per-square-foot data. — free online calculator.