

Allele Frequency Calculator
Calculate allele frequencies. Explore genotype patterns and Hardy–Weinberg equilibrium.
Two alleles • diploid autosomal locus • A/a labels do not imply dominance.
Population & model inputs
From individuals to allele copies
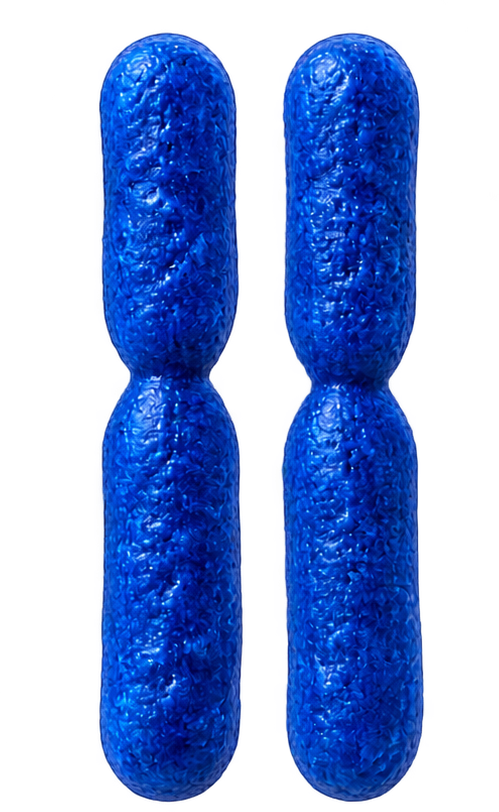 AA
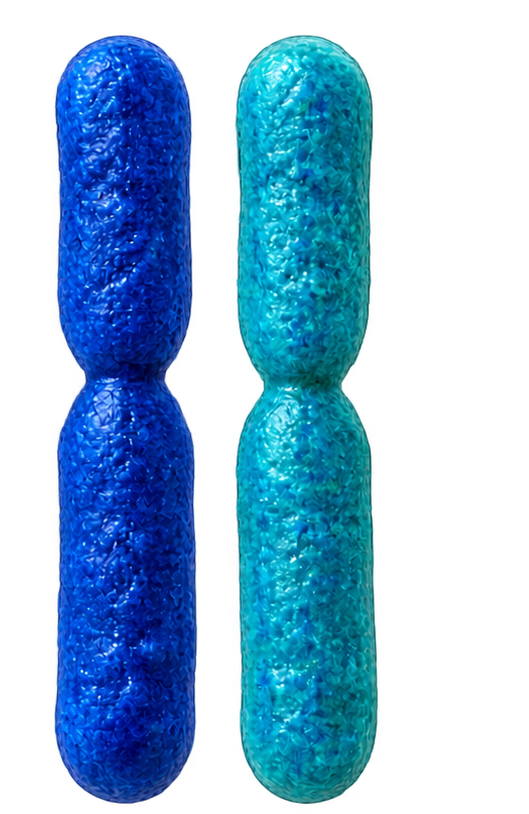 Aa


Allele frequencies & genotype profile
Biallelic modelA copies: 100 • a copies: 100 • p + q = 1
Step-by-step solution
Observed vs Expected Genotypes
| Genotype | Observed | Expected (HWE) | χ² contribution |
|---|---|---|---|
| AA | 30 | 25.00 | 1.0000 |
| Aa | 40 | 50.00 | 2.0000 |
| aa | 30 | 25.00 | 1.0000 |
Descriptive sample ratios; not an unbiased population F-statistic estimator.
View genotype proportions
Blue: AA • teal: Aa • violet: aa
Text summary · PDF in member tools.
p² + 2pq + q² = 1 is an identity, not an equilibrium test. Sparse expected counts need exact methods; monomorphic loci are not informative for this test.
How allele frequencies are calculated
Expected genotype counts under HWE:
Pearson uses df = 1 because p is estimated from the same sample. The two-sided exact test sums conditional tables no more probable than the observed table; it is not a mid-P test.
HWE expectations assume random union of alleles. Interpret a sample of unrelated diploid individuals at one autosomal, biallelic locus; pooled populations, relatedness, genotype uncertainty and missingness require separate consideration. A departure does not identify its cause.
Frequently asked questions
Can allele counts alone test equilibrium?
No. Direct counts determine p and q and the expected HWE proportions, but observed AA, Aa and aa counts are required to compare with the expected distribution. Population size is not inferred from pooled allele copies in direct mode.
Does p² + 2pq + q² = 1 prove HWE?
No. This identity follows from p + q = 1. It holds for the model probabilities even when the observed genotype distribution differs strongly. The statistical test compares observed genotype counts with expected counts.
When should I use an exact test?
Exact testing is particularly useful for sparse or small expected counts, where the asymptotic Pearson approximation can be unreliable. The tool supports a two-sided probability-ordered conditional exact test for up to 200,000 copies of the rarer allele. Above this local computation limit, it reports the limit rather than substituting another test. Monomorphic samples are marked not informative.
Does A always mean a dominant allele?
No. A and a are allele identifiers in this biallelic model. Uppercase notation does not establish dominance or phenotype. The tool models unrelated diploid individuals at an autosomal locus; sex-linked, haploid, mixed-ploidy and multi-allelic models need different methods.
Show all questions (10 more)Show fewer questions
What does the Allele Frequency Calculator calculate?
It counts allele A as 2×AA + Aa and allele a as 2×aa + Aa, then divides by total allele copies. It also provides genotype expectations and optional HWE assessment, not an individualized genetic or medical diagnosis.
Which values should I enter?
Enter nonnegative whole observed genotype or allele counts. The active population/allele total must be positive. Missing counts, fractional counts and unsupported integer magnitudes are rejected. Direct mode takes separate A and a counts; 30 out of 100 is entered as 30 and 70.
What formula does this calculator use?
N = AA + Aa + aa; p = (2AA + Aa)/(2N); q = (2aa + Aa)/(2N). HWE expected genotype frequencies are p², 2pq and q². Pearson χ² sums (O−E)²/E and uses one degree of freedom for this sample-estimated biallelic model.
Why might my result differ from another source?
Methods may use Pearson approximation, continuity correction, probability-ordered exact tests or mid-P values. This tool uses uncorrected Pearson and a standard two-sided exact test without mid-P adjustment. Alpha is chosen by the user. Missingness, relatedness and locus assumptions affect interpretation.
Does the result update automatically?
Yes. Counts, methods and alpha update results. The third top card loads the 25/50/25 HWE example; it is not a distinct input model. Quick examples load specified counts. Statistical significance depends on the selected test and alpha; changing alpha does not change χ² or the P-value.
Does a significant result identify the cause?
No. Departure may have many explanations, including sampling, population structure, nonrandom mating, genotyping error or selection. A statistical result alone does not establish which mechanism is responsible. Failure to reject also does not prove that all HWE assumptions hold.
How are sparse counts and monomorphic loci handled?
If any positive expected count is below 5, the Pearson P-value is labeled an unreliable approximation and the decision is withheld; use Exact HWE instead. If one allele is absent, the test is not informative and no division by zero, χ² inference or equilibrium claim is made. The allele frequency remains valid.
What does the visualization show?
Native proportion bars compare observed and expected percentages; they do not imply causal or phenotype differences. The chromosome illustrations show AA/Aa/aa categories only and are not a literal population or detailed anatomical map.
What do Ho, He and FIS mean?
Ho is observed heterozygosity Aa/N. He is expected heterozygosity 2pq from sample allele frequencies. The displayed descriptive FIS ratio is 1−Ho/He; positive values indicate a heterozygote deficit relative to that expectation, negative values an excess. It is undefined when He is zero. It is not an unbiased population F-statistic estimate or an independent test of inbreeding.
What does the Allele Frequency calculate?
Allele Frequency Calculator: calculate allele frequency from the supplied inputs.
Sources & References
 Nature Education — Hardy–Weinberg PrincipleScitable genetics reference ↗
 NCBI / PMC — HWE Test MethodsWigginton, Cutler & Abecasis (2005), peer-reviewed method ↗
 Abecasis Lab — SNP-HWEConditional exact test reference implementation ↗
Logos identify sources; no institutional endorsement. NCBI/PMC hosts the linked research article.
Related calculators
Allele Frequency Calculator: calculate allele frequency from the supplied inputs.