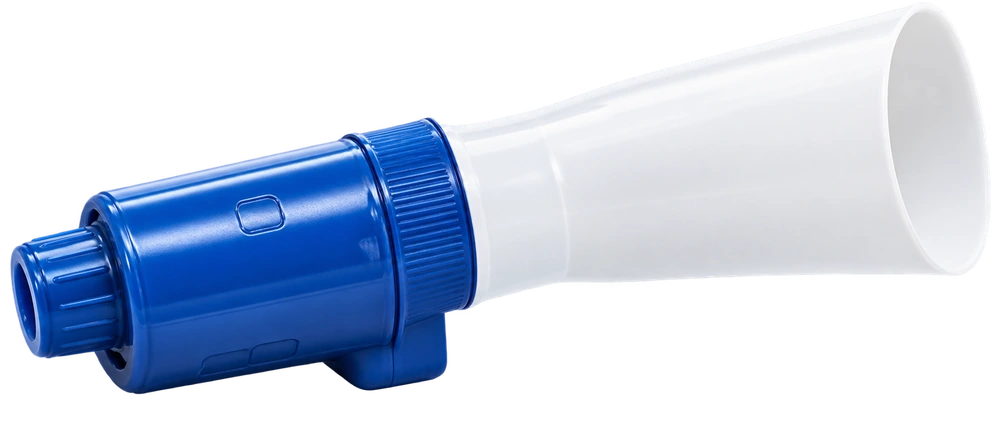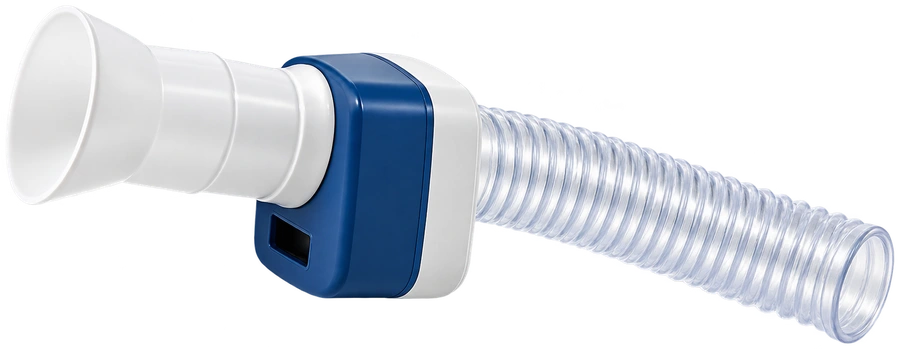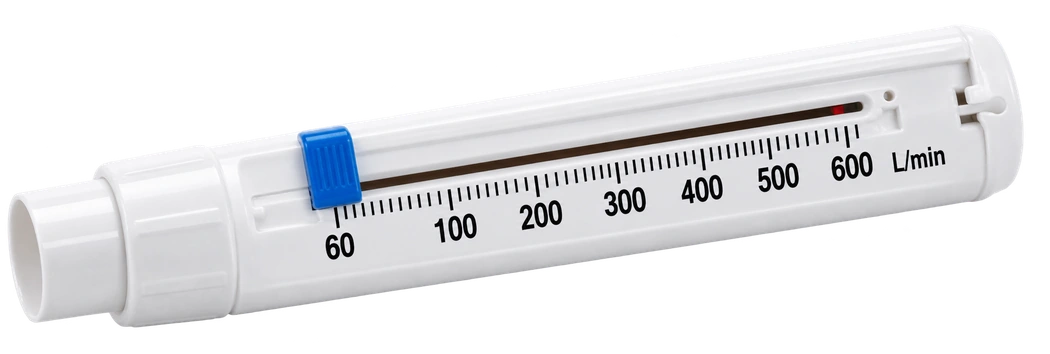
Reference estimate
Age, height and equation shape the estimate.
Explore your reference. Compare like for like. Know what the number means.
Age, height and equation shape the estimate.
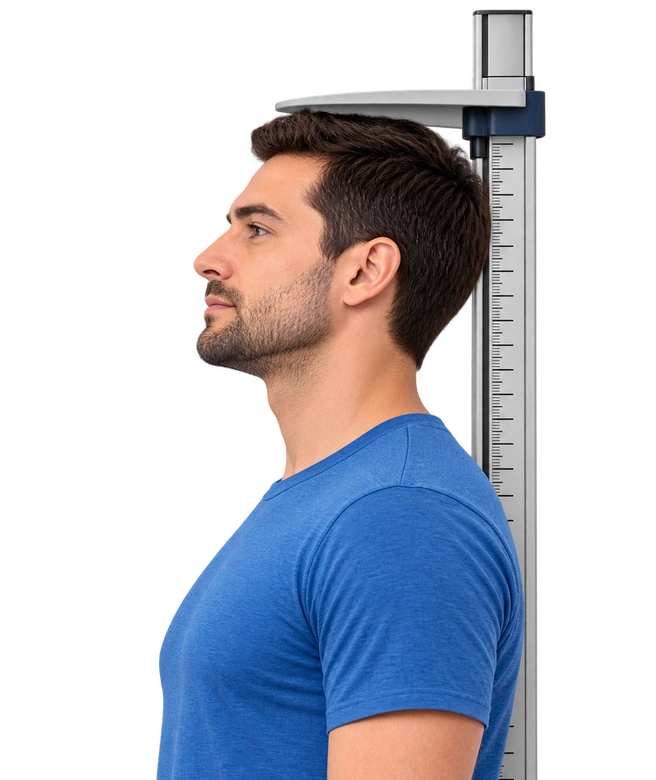
Use your measured standing height.
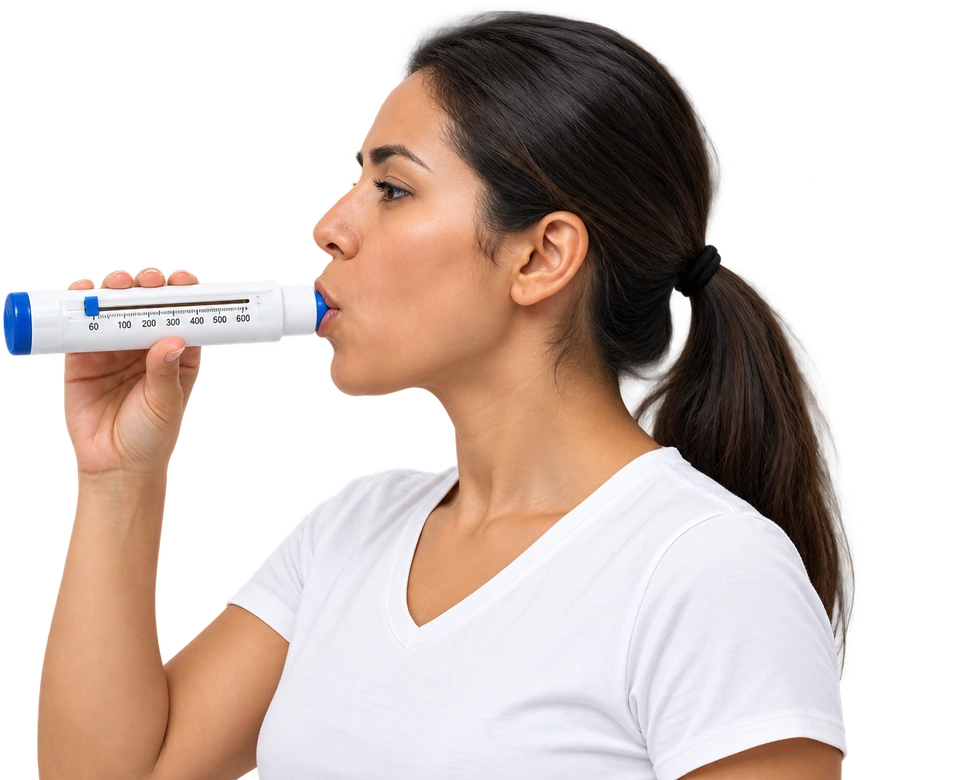
Use the same device and correct technique.
L/min
No resultThis percentage does not diagnose obstruction or restriction.
100% is the predicted mean, not a pass/fail threshold.
Only compatible declared scales can be compared.
Asthma action zones use your clinician-agreed personal best, not this population estimate.
Nunn–Gregg (1989), male
PEF = exp[0.544 ln(age) − 0.0151 age − 74.7/height(cm) + 5.48]
Enter values to calculate.
Historical population model. Meter scale and reference population affect comparison.
The Nunn–Gregg (1989) equations use natural logarithms and exponentials. Male: exp[0.544 ln(age) −0.0151 age −74.7/height(cm) +5.48]. Female: exp[0.376 ln(age) −0.0120 age −58.8/height(cm) +5.63]. The female age coefficient follows the original paper, 0.0120. This is not the simple linear approximation shown by some online tools.
The study used a historical UK cohort of lifelong nonsmokers and Wright meters. It provides references for ages 15–85 and is not a universal reference for every population or device. No race/ethnicity adjustment is added. Appropriate device and reference selection should be confirmed with a clinician.
Original Wright and EU/EN scales are not automatically interchangeable. This page performs no scale conversion. In demographic mode the reference scale is Wright. In report/device mode the reference is supplied by you. A comparison percentage is shown only when both declared scales match and are known. The explicit same-report/device option requires your confirmation in both scale selectors; it does not verify device compatibility independently.
Percent predicted = measured PEFR ÷ unrounded reference ×100. Reference PEFR is displayed to the nearest L/min and percentage to one decimal. The blue gauge is linear from 0% to 120%, with 100% marking the predicted reference. Values above 120% keep their numeric percentage but cap only the chart marker. With no measured value, or unconfirmed/different scales, there is no comparison marker or percentage. Unrounded calculations are ordinary double-precision estimates, not a claim of device precision.
The 100–230 cm standing-height entry bound and reference 1–5,000 L/min / measured 0–5,000 L/min bounds are software input safeguards, not validated normal ranges. Values outside these height safeguards require an appropriate report/device reference. Age outside 15–85 is not extrapolated. A zero reading is displayed numerically when comparable, without assigning a disease category.
Population predicted PEFR is not personal best. Asthma action-plan zones should use the personal-best value agreed with your clinician and your symptoms. A population percentage alone cannot diagnose obstruction, restriction, asthma control or disease severity. Follow your written asthma plan and do not change treatment from this result.
No. This is a population reference estimate, not your personal best. Asthma action zones use the personal best agreed with your clinician and your symptoms. Use the Peak Flow Zones page with that personal-best value.
Reference equations, device calibration scales, technique and the reference population can differ. The demographic model here is the original Nunn–Gregg 1989 Wright-scale reference. Do not compare it directly with an EU/EN reading; use the appropriate report/device reference instead.
No. The percentage is only a reference comparison on compatible declared scales. It does not diagnose airflow obstruction or restriction, classify asthma control or produce a medication plan. Severe breathing difficulty, trouble speaking or blue lips require emergency help regardless of any reading.
Yes. Select Report / device reference, enter the positive reference in L/min, and explicitly select compatible reference and reading scales. Demographic inputs are not used in that mode. If either scale is unknown or they differ, the percentage is withheld.
References only. No institutional endorsement.
Explore your reference. Compare like for like. Know what the number means.